Wang Jiuliang’s independent documentary Plastic China
(2016, 82 mins), available now on Youtube and Amazon Prime, for the first time reported in depth the dark truth of plastic waste industry in China. Shortly after it went viral, the documentary was banned from the internet in China in 2017. However, the impact of Wang’s work in China can be compared to Rachel Carson’s “Silent Spring” in the Unite States. The environmental movement finally led to the official ban of the import of 24 kinds of solid wastes from foreign countries, implemented on January 1, 2018.
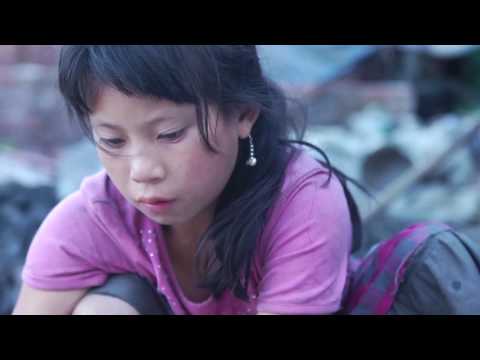
In the documentary, the workers were sorting plastic waste without any personal protection equipments. Due to the mismanaged plastic waste everywhere in the opening, local environments deteriorated so bad: water became undrinkable, burning plastic smell filled the air upon huge mountains of dumps. Local children had no where to go and found trotting on the hills of plastic waste, picking up random items to explore, unknowing the tremendous danger they are facing.
“Plastics are hard to sort. There are hundreds of them, something polyester, something polychlorine, something benzene, something polyoxymethylene. Experienced man lights them up and can tell by the burning smell,” says old worker Yu in the documentary, “…, you can find almost any rotten things among the plastic dump: spoiled meat with fly larvae in cans, stinking dried up spoiled milk in milk container, ragged dirty socks, syringes with needle attached and unknown liquid inside. I know this poor 70 year old grandma, She was trying to empty a container and got her hands burned. It was unlabeled but has Hydrofluoric acid inside, they said. And some are waste metal that contains radioactive materials beyond safe level. All our clean water was used to rinse them, that’s tons of water, now we are left without any clean water to drink.”
My heart sank just by watching the trailer. So, how bad is the situation, how much plastic waste do we generate per year, where do they come from and where do they go? Are those globally traded plastic waste all on record? There are so many things to ask if we think about it. Where is the big data for it? I looked into various sources and gathered some data compiled by our world in data. Using Python, I was able to generate some interesting plot and looked into the following three questions:
- What is the current situation for plastic waste generation?
- Is plastic mismanagement related to low GDP?
- What is the most important factor regarding waste reduction?
Hopefully by sharing my findings, we can inspire more and more people to dedicate their intelligence power to figure out a way to solve our plastic waste problem.
The plastic waste are either discarded, incinerated, or recycled. The percentage of recycled plastic is increasing each year, but still less than 10% as estimated in 2015. The discarded plastic waste goes either to landfill or mismanaged. Mismanaged plastic waste is either littered or inadequately disposed. Mismanaged waste is likely to enter the ocean via wind, tidal or inland river transport.

The total generated plastic waste globally in 2010 was over 273 million tons, and 1.9 million tons were littered. Given a common plastic credit card of 5 grams, we can picture ourselves generating a median of 5971 credit cards per person per year worldwide and each of us littered 55 pieces of the credit cards annually.
If we plot the plastic waste littering vs. generation for all countries where bubble size representing population, we can see that the Unite States, China, Japan, Brazil, Germany are the top 5 in plastic waste generation in 2010. China is the top 1 in plastic generation. US is the top 1 in both plastic littering and plastic waste per capita. Germany drops out of the top 5 list on littering. India (next to Mexico on the scattered plot) as the second most populated country has a surprisingly low per-capita plastic waste.

Now let’s look into the per-capita data on earth’s geomap, Kuwait, Guyana, Germany, Netherland, Ireland, Sri Lanka, and the United States topped the rest of the world on generating plastic waste in 2010, as shown below. Being the largest country among the top list, USA can make a huge impact on the global reduction of plastc waste.

Gross Domestic Product (GDP) is the monetary value of all finished goods and services made within a country during a specific period. We tend to associated low GDP with more mismanaged plastic waste. However, a closer look at the scattered plot of mismanaged plastic waste per capita vs. GDP per capita, bubble size reflecting a country’s population, there is no visually clear trend or dependence of the two variables. Waste mismanagement is not necessarily correlated to low GDP. Policy, culture, and other important factors all need to be examined case by case analyzing the difference between countries. Comparing China and India (two largest countries population wise), China obviously should learn from India in the future to reduce waste per capita and not to stress its environment for GDP growing. The United States seems to have done a good job managing its plastic waste while maintaining the highest GDP, or, its low value in mismanagement is due to the transfer of plastic waste burden to other countries to avoid the high cost of domestic management?

China had the largest plastic waste import in the world, before the ban implemented in January 2018. A look into the source of China’s plastic waste import can give some insight on the waste traffic globally. The total amount of plastic waste China imported in the year of 2016 was over 7 million tons (7,134,966 tons). Given the population of 1.379 billion in China in 2016, per-capita waste received from foreign country was 5.2 kg. In other words, each person in China were given 1000 wasted credit cards waste to handle.
So how can we effectively reduce the plastic waste? As pretty much all environmental engineers and scientists agree, the best way to reduce a waste is to cut it down at the source. The bar plot below shows the sources of the plastic generation and waste generation. Plastic waste generation is positively related to plastic product generation. So if we reduce the generation of product, we can reduce the generation of its waste. Comparing the sectors in the bar plot, we can tell the No.1 source is packaging. We are wasting millions of tons of our resources on packaging!

So, I started pondering on what I can do to reduce plastic packaging, and came out with a list:
- Avoid overpackaged gifts
- Bring a canvas tote bag for grocery shopping
- Carry reusable water bottle or own coffee mug
- Buy bulk food from local food co-op
- Opt for minimal packaging when order online
- Considering serve biryani rice in cabage or banana leaves at your party
- Go for edible spoon/forks which are good for earth and tummy!
Okay, enough data wrestling for today! I am going back to my kitchen launching a fun homemade edible spoon project. Here is the link to the recipe I am going to try. :)